
Research in neuroanatomy
100 years after Ramon y Cajal's groundbreaking work, much remains poorly understood in functional neuroanatomy, but his neuron doctrine continues to stimulate us. Using transgenic mouse models, we are now able to study the cell types of the cerebral cortex, their molecular properties, the synaptic connections and also approximately their function. These studies aim to identify the neuronal basis for decoding tactile stimuli. Such tactile sensations are used by rodents with their whiskers and humans with their fingertips every day to gather information about the world and interact with it through goal-directed motor skills.
Insight into our research
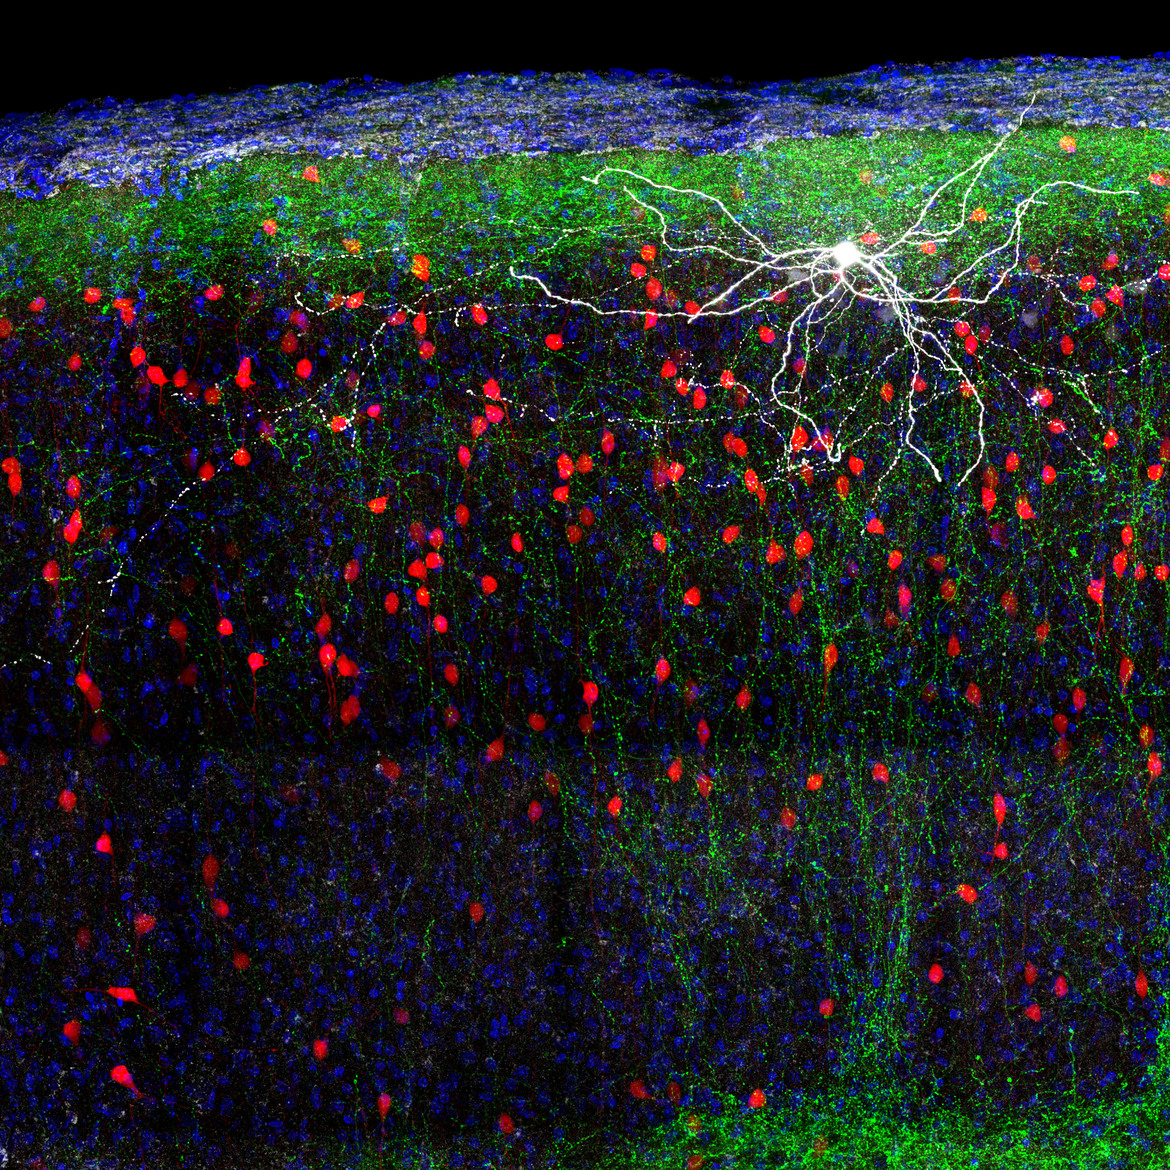
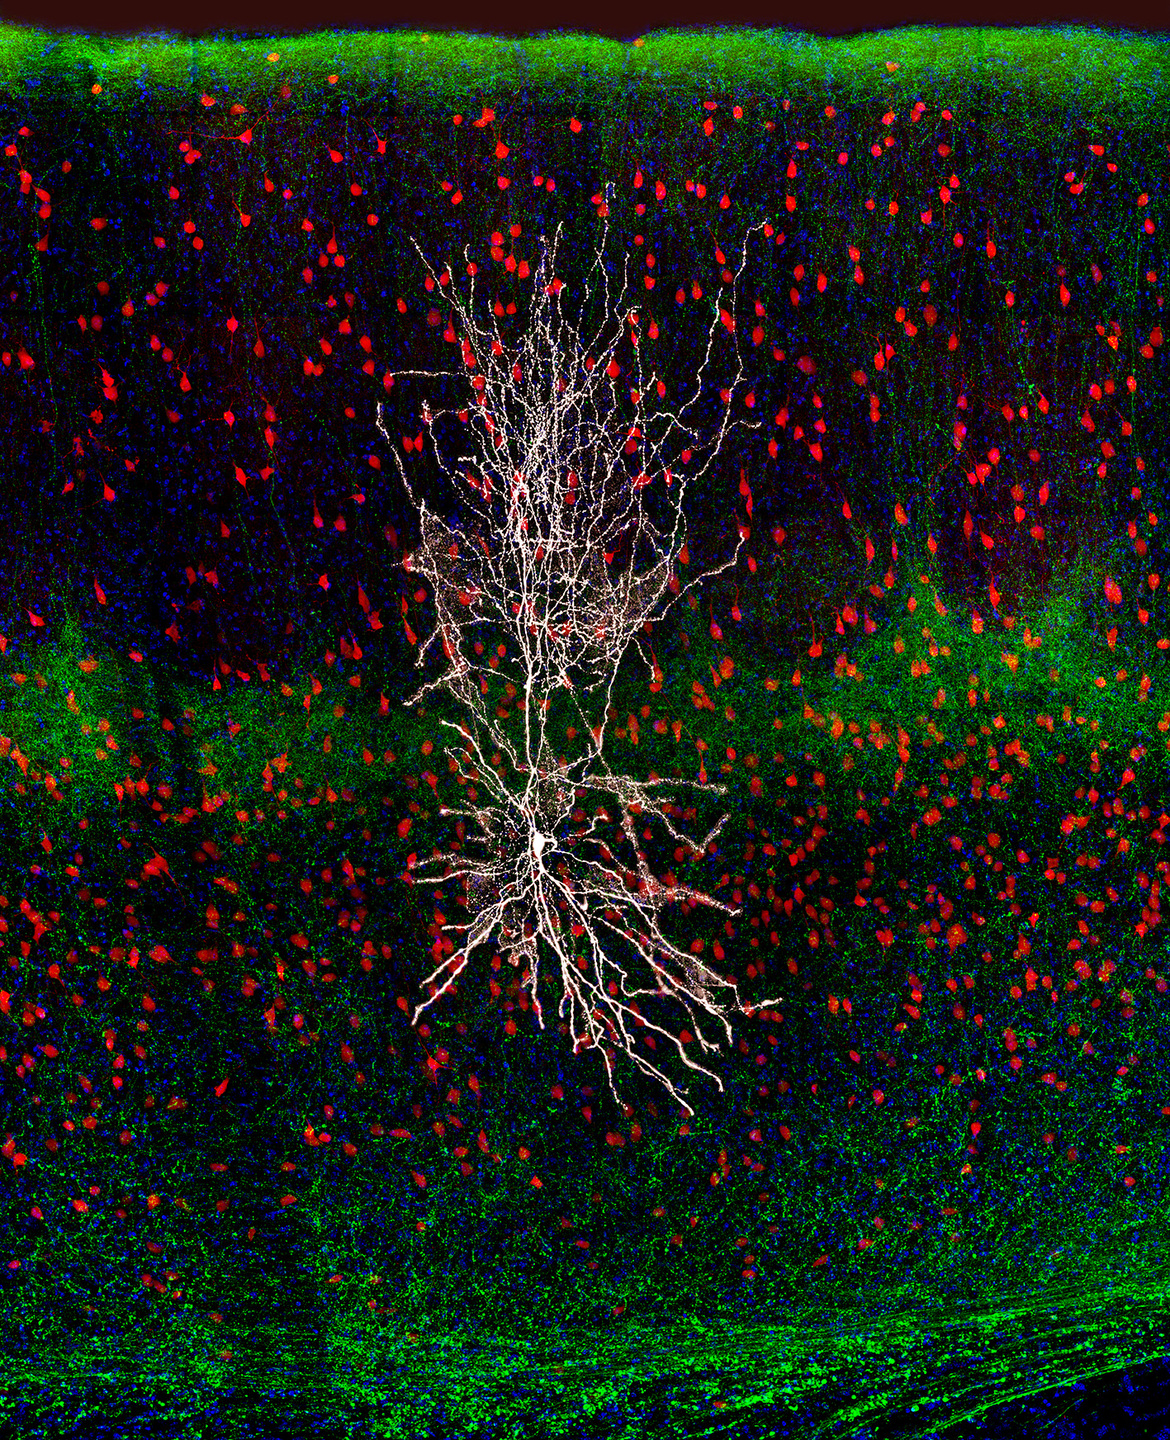
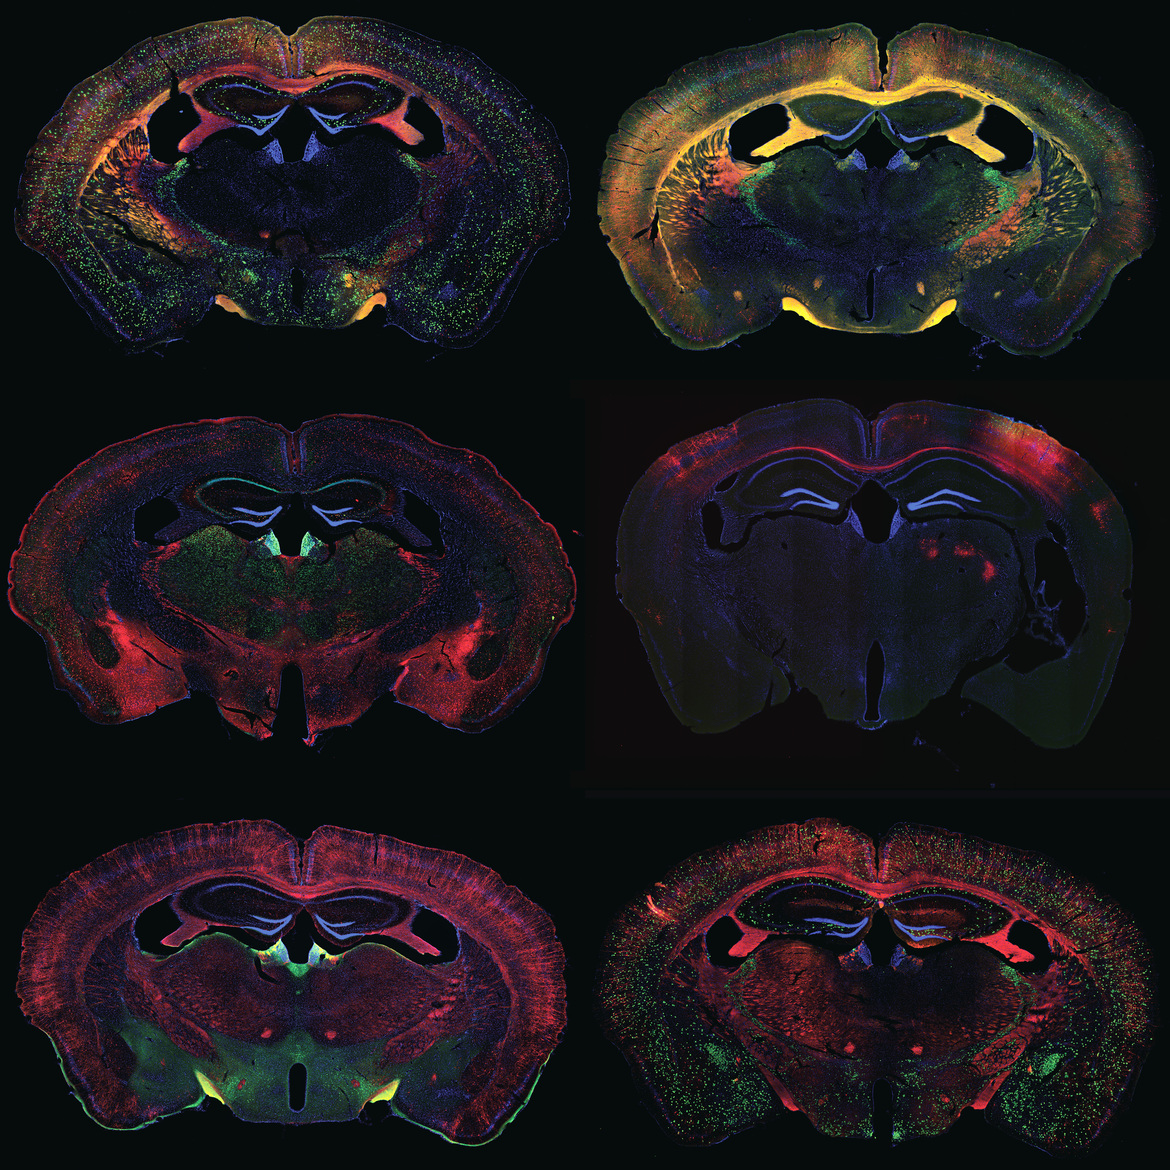
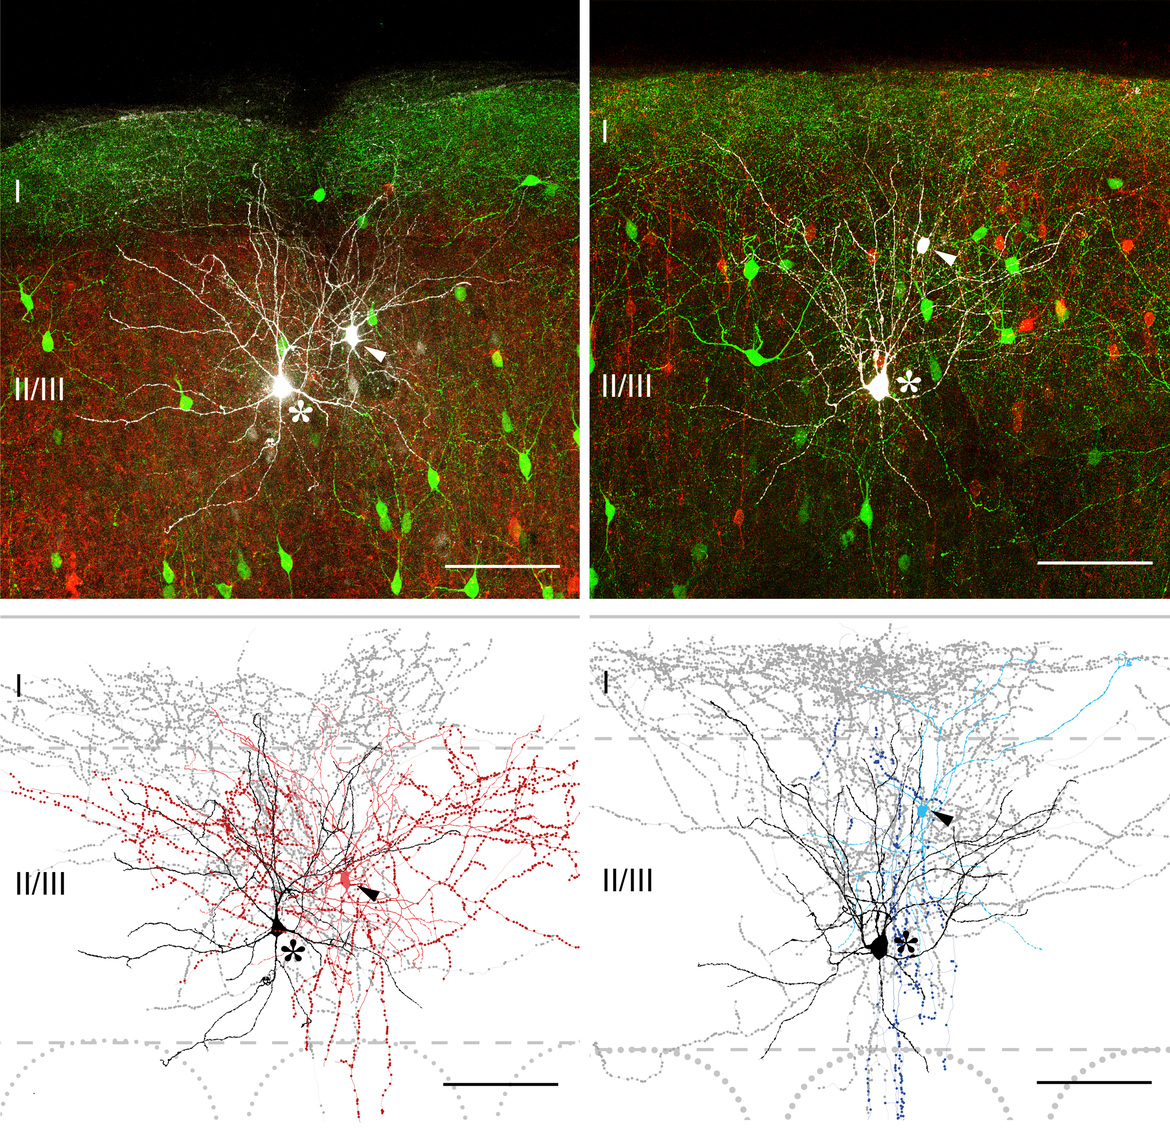
Figure 1: 4-channel fluorescence image from the somatosensory cortex of the adult mouse. Shown in white is an electrophysiologically characterized and biocytin-filled VIP cell of layer I of the cerebral cortex. The total population of all VIP cells stained with a genetically encoded dye is shown in red. Axons from the thalamus are visualized in green and all other cell nuclei are seen in blue in the volume shown with a maximum intensity projection.
Figure 2: 4-channel fluorescence image from the somatosensory cortex of the adult mouse. Shown in white is an electrophysiologically characterized and biocytin-filled somatostatin-expressing non-Martinotti cell of layer Vb of the cerebral cortex. The total population of all somatostatin cells stained with a genetically encoded dye is shown in red. Axons from the thalamus are visualized in green and all other cell nuclei are seen in blue in the volume shown with a maximum intensity projection.
Figure 3: Composite image of the wiring of GABAergic neurons in the somatosensory cortex of the adult mouse. At the top of the left double image (in white) are a presynaptic basket cell (arrowhead) and a postsynaptic Martinotti cell (asterisk) selected from the total population of parvalbumin-expressing cells (red) and GIN cells (green). Below is the basket cell reconstructed in red and the Martinotti cell reconstructed in black. In the right double image, a presynaptic VIP cell (arrowhead) and a postsynaptic Martinotti cell (asterisk) can be seen at the top (in white), selected from the total population of VIP-expressing cells (red) and GIN cells (green). became. Below you can see the VIP cell reconstructed in blue and the Martinotti cell in black. The cell pairs are each localized in layer II/III.
Figure 4: 3-channel fluorescence images from the brain of the adult mouse, at the level of the dorsal "seahorse" (blue, bilaterally symmetrical structure). Each slice shows a neurochemical snapshot of the brain, staining mainly inhibitory neurons and their receptors.